Quarterly Portfolio Manager Commentary
March 31, 2024

Cash Management Portfolios
What market conditions had a direct impact on the bond market this quarter?
Economic Activity – U.S. economic growth continues to defy expectations for a near-term slowdown, showing remarkable resilience to restrictive Federal Reserve (Fed) policies. Despite concerns over high interest rates and elevated inflation, first quarter (Q1) U.S. Gross Domestic Product (GDP) growth is projected near 2.0% to 2.5% for the quarter on solid business activity and services spending momentum. Personal consumption accelerated throughout Q1 as U.S. households continue to benefit from strong job and income gains. The labor market continues to normalize, however, the pace of rebalancing slowed in Q1. February U.S. job openings declined to 8.8 million open positions compared to 8.9 million at the end of Q4 while total unemployed workers in the labor force as of March rose to 6.4 million reflecting strong immigration and a higher participation rate. Monthly Non-farm Payrolls (NFP) growth accelerated, averaging 276,000 during Q1 and the U3 Unemployment Rate remained strong at 3.8% in March. Growth in Average Hourly Earnings is off its highs but still elevated at 4.1% year-over-year (YoY), emphasizing persistent firm labor demand. Headline inflation readings eased during the quarter, reflecting further declines in energy prices with the Consumer Price Index (CPI) at 3.2% in February versus 3.4% in December. Core inflation continued its gradual downward trend with CPI ex. food and energy rising 3.8% YoY for February compared to 3.9% YoY in December. The Fed’s preferred inflation index – the PCE Core Deflator Index – increased 2.8% YoY for February. Despite the annual improvement, progress on inflation stalled during the quarter with monthly price measures appearing to reaccelerate. Recent inflation trends validate the Fed’s decision to be patient on the start of rate cuts as more evidence of a sustained inflation decline is needed.
Monetary Policy – The Fed elected to keep its target range for the federal funds rate unchanged at 5.25% to 5.50% at the January 31 and March 20 meetings. Maintaining the target range throughout the quarter was anticipated by the market and minimal changes were made to the post-meeting statement’s characterization of the economy. Fed officials noted they need greater confidence inflation is moving sustainably toward their 2% target before reducing policy rates. The Fed continued to implement its balance sheet reduction program (quantitative tightening (QT)), with a monthly cap of $60 billion in Treasury securities and $35 billion of agency mortgage-backed securities but noted it will likely be appropriate to begin slowing the pace of QT at subsequent meetings.
The Federal Open Market Committee (FOMC) released its updated Summary of Economic Projections at the March meeting which show Fed officials anticipate faster economic growth this year along with a slightly lower unemployment rate and marginally higher core inflation. Revisions to economic assumptions in 2025 and 2026 were minimal. The median projection for the federal funds rate at the end of 2024 was unchanged at a range of 4.5% to 4.75%, reflecting continued expectations for 75 basis points (bps) of rate cuts this year despite the anticipated increase in growth. The economic projections appear to reflect a best-case scenario and suggest the FOMC no longer believes a sustained period of below-potential growth is required to bring price pressures down, implying inflation can decline towards the Fed’s 2% target without a slowdown in growth or deterioration in unemployment.
Fiscal Policy – During the quarter, Congress narrowly avoided a government shutdown by passing two annual appropriation bills in March which will fund the federal government through the remainder of fiscal year 2024 (end September). Overall spending levels are in line with the $1.6 trillion set as part of last year’s debt limit agreement which keeps nondefense discretionary spending flat in 2024 while capping growth at 1% in 2025. With defense spending set to increase about 3% in 2024 these levels imply a reduction in real spending over the next two years and suggest government spending will have a modest dampening effect on economic growth in 2024 and 2025.
Looking further out, the Infrastructure and Jobs Act (2021) and Inflation Reduction Act (2022) will boost government spending over the long-term, but near-term impacts are likely to be minor. On the municipal side, state and local government finances are starting to diverge with municipal entities more dependent on sales and property taxes faring better than those dependent on income taxes, but strong reserves have left the overall sector in a solid position if economic conditions weaken further.
Credit Markets – U.S. Treasury yield curve levels moved higher in the quarter as stubbornly firm inflation data and better than expected economic growth pushed out the start of anticipated 2024 Fed rate cuts. While the move higher was significant, yield curve volatility was more subdued in the quarter with fewer major intra-day rate moves than in previous periods. Despite QT and what are likely peak Fed policy rates for this cycle, financial conditions remain accommodative and continue to support credit spreads. Elevated index yields and tighter credit spreads provided a cushion against the negative price action of higher rates, with credit sensitive and short treasury indexes posting overall positive returns for
the quarter.
Yield Curve Shift
|
U.S. Treasury Curve |
Yield Curve 12/31/2023 |
Yield Curve 3/31/2024 |
Change (bps) |
|---|---|---|---|
|
3 Month |
5.332% |
5.362% |
2.9 |
|
1 Year |
4.762% |
5.024% |
26.2 |
|
2 Year |
4.250% |
4.620% |
37.0 |
|
3 Year |
4.009% |
4.409% |
40.0 |
|
5 Year |
3.847% |
4.212% |
36.5 |
|
10 Year |
3.879% |
4.200% |
32.1 |
Duration Relative Performance
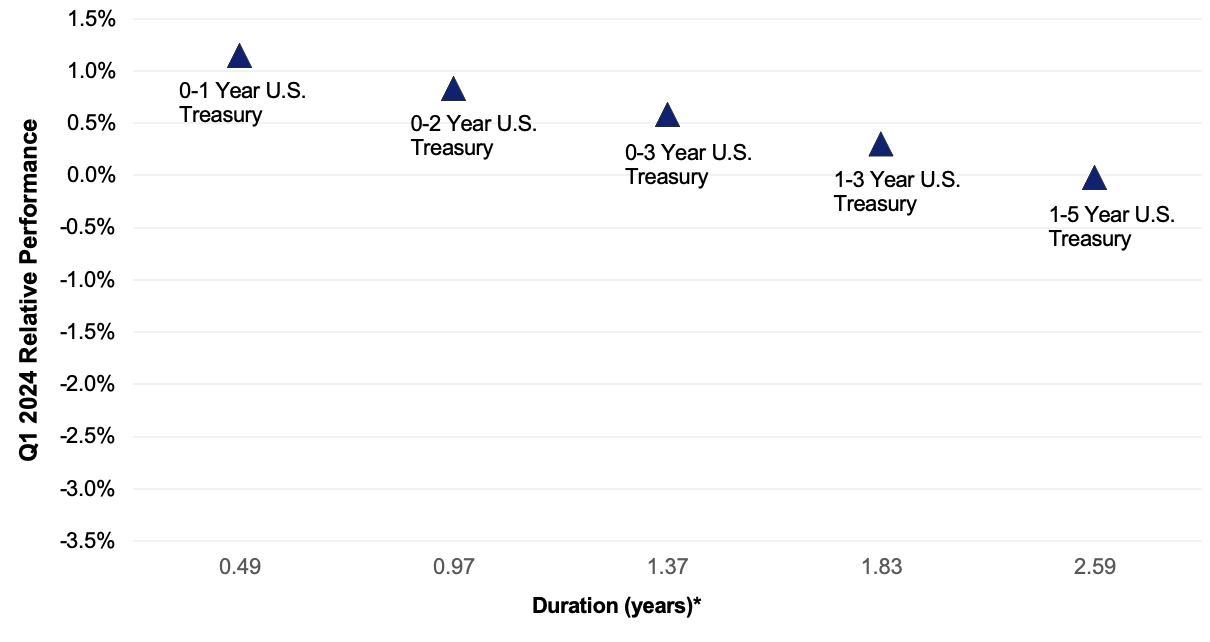
*Duration estimate is as of 3/31/2024
As expected, when rates move higher, short duration strategies outperformed longer strategies in the quarter. The three-month to five-year portion of the yield curve steepened 37.1 bps in the quarter, benefitting a more bulleted portfolio structure.
Credit Spread Changes
|
ICE BofA Index |
OAS* (bps) 12/30/2023 |
OAS* (bps) 3/31/2024 |
Change (bps) |
|---|---|---|---|
|
1-3 Year U.S. Agency Index |
10 |
9 |
-1 |
|
1-3 Year AAA U.S. Corporate and Yankees |
10 |
10 |
0 |
|
1-3 Year AA U.S. Corporate and Yankees |
34 |
29 |
-5 |
|
1-3 Year A U.S. Corporate and Yankees |
65 |
55 |
-10 |
|
1-3 Year BBB U.S. Corporate and Yankees |
97 |
85 |
-12 |
|
0-3 Year AAA U.S. Fixed-Rate ABS |
69 |
55 |
-14 |
Option-Adjusted Spread (OAS) measures the spread of a fixed-income instrument against the risk-free rate of return. U.S. Treasury securities generally represent the risk-free rate.
Credit spreads continued to tighten as unexpectedly strong first quarter economic growth, improving prospects for an economic soft landing and accommodative financial conditions supported the outlook for credit and spread product. Continuing a recent trend, credit spreads on lower-rated issuers outperformed as concerns over slowing growth and corporate refinancing risk eased. AAA-rated ABS spreads were noticeably tighter despite deterioration in sub-prime consumer debt performance. AAA-rated ABS spreads and single-A U.S. corporate debt ended the quarter with identical OAS spreads.
Credit Sector Relative Performance of ICE BofA Indexes
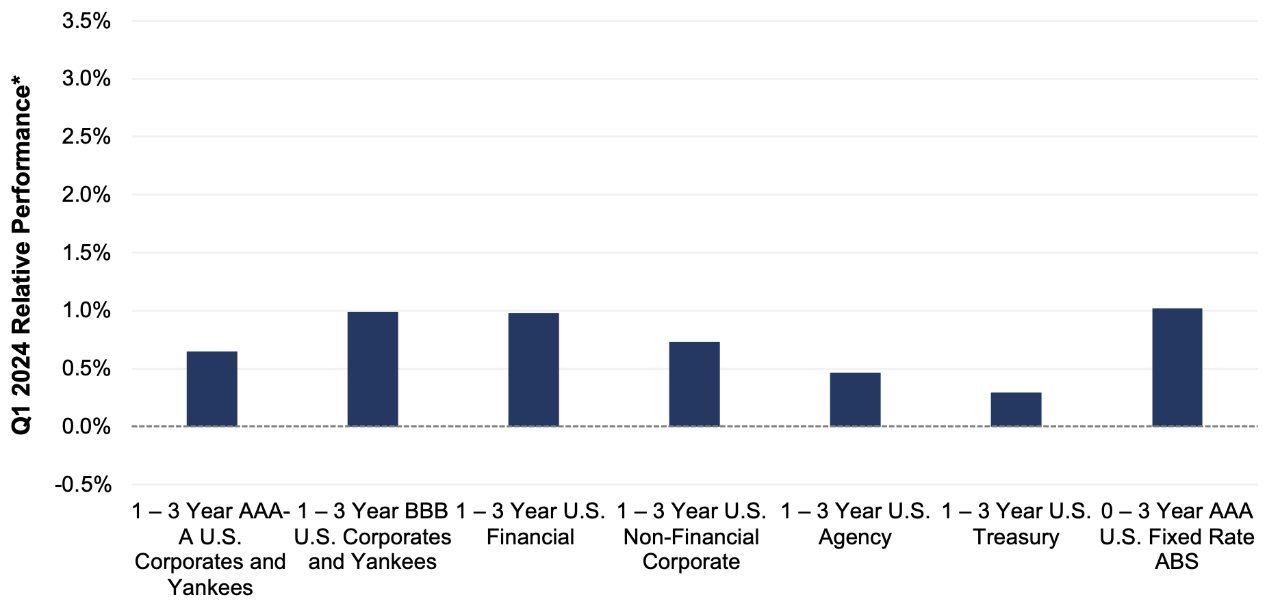
ICE BofA Index
*AAA-A Corporate index outperformed the Treasury index by 35.3bps.
*AAA-A Corporate index underperformed the BBB Corporate index by 33.8bps
*U.S. Financials outperformed U.S. Non-Financials by 26.0 bps
The trend of U.S. financials outperforming non-financial corporate debt continued. The financial index saw greater credit spread tightening in the quarter and at the same time retained a 16 bps OAS spread advantage over the non-financial index (73 bps vs. 57 bps) at quarter-end.
What were the major factors influencing money market funds this quarter?
The first quarter of 2024 continued with the FOMC on hold and the market taking a less dovish tone, as economic and employment data remained firm while inflation gauges proved more stubborn than anticipated. The Fed left rates unchanged at a range of 5.25% to 5.50% at the March 20 meeting and indicated they still anticipate three rate cuts by year-end. The committee’s commentary brought federal fund futures and the Fed Dot plot in-line, with both forecasting 75 bps in rate cuts in 2024. There are a wide range of opinions on the timing of future rate activity, so the challenge for managers going forward is determining how the economy and inflation will influence FOMC action.
Money market fund assets continued to increase during the quarter, as elevated money market yields attracted investors. With the Fed focused on price stability, money market funds remain an attractive investment option for fixed income investors.
First American Prime Obligations Funds
Credit conditions and trading ranges appear stable given the current rate and geopolitical environment. Considering the yield curve and a conservative cash flow approach, the First American Funds were positioned with strong portfolio liquidity metrics influenced by Fund shareholder makeup. We continued to employ a heightened credit outlook, maintaining positions presenting minimal credit risk to the Fund’s investors. During the first quarter, our main investment objective was to maintain liquidity while opportunistically enhancing portfolio yield based on our economic, credit and interest rate outlook, along with considerations of investor cash flows. We believe the credit environment and higher relative fund yields make the sector an appropriate short-term option for investors.
First American Government and Treasury Funds
Treasury bill/note supply continued to expand as the Fed continued quantitative tightening and overall debt needs increased. Front-end treasuries provided a marginal yield pick-up, providing government and treasury money market funds a with a Repo substitute. With the Fed on hold and their next move most likely a downward move in rates, managers extended durations, investing in longer-term securities to get ahead of a forecasted lower yield environment. The extension into lower yielding long-term securities has put marginal downward pressure on portfolio yields. When presented with appropriate value, we also purchased floating-rate investments designed to benefit shareholders over the securities holding period. Our investment strategy will be fluid in the coming quarters as markets make determinations on the Fed’s comfort level with inflation and ultimately the timing and pace of future rate moves.
First American Retail Tax Free Obligations Fund
Tax-exempt money market yields, and in particular variable rate demand notes (VRDNs), remain highly sensitive to changes in supply and demand. During January, these swings in rate resets reached extremes as the Securities Industry and Financial Markets Association (SIFMA) Municipal Swap Index traded in a wide range of more than 250 bps. Supply/demand imbalances arose from a confluence of artificially high yields at year-end (dealer reluctance to carry inventory on balance sheets) and seasonally high reinvestment from municipal bond maturities as the calendar turned to January. The surge in demand was marked by the highest level in ICI Money Market Funds Tax Exempt Assets since the middle of 2020. Industry assets eventually stabilized, and resets in February and March were much less volatile. Portfolio management strategy continues to be focused on increasing allocations to fixed rate investments and extending the Fund’s weighted average maturity. Recently, we added more exposure to notes with one-year maturities. If Fed rate cuts are realized as anticipated, these longer positions are expected to be especially beneficial to the Fund’s yield in the second half of the year and into 2025.
What near-term considerations will affect fund management?
Industry-wide, prime fund yields have probably peaked and will gradually fall as managers roll maturities into flat to lower yielding securities that are pricing in the possibility of future rate cuts. Compression in credit spreads will also narrow SOFR floating rate coupons, putting marginal downward pressure on portfolio yields. However, broadly speaking, front-end yields in credit securities should continue to benefit from the overall supply increase in Treasury securities, as well as the reduced demand from impending money market fund reform, creating competition among credit issuers for the marginal dollar. Based on our market outlook and breakeven analysis, we will seek to capitalize on investment opportunities that make economic sense. The Institutional and Retail Prime Obligations Funds should remain reasonable short-term investment options for investors seeking higher yields on cash positions while assuming minimal credit risk.
Yields in the government-sponsored enterprise (GSE) and Treasury space will remain influenced by Fed policy and Treasury bill/note supply. With front-end yields elevated and the Fed still wary of inflation, we expect the investment environment for government money market funds should remain attractive. As with non-government debt, Government and Treasury fund yields have probably peaked and will continue to gradually decline as managers roll maturities into securities with lower yields that are pricing in future rate reductions. We anticipate some moderate yield dislocations in Treasury and GSE issues as the influx of bill supply and continued QT increase competition as bonds look for a home away from dealer balance sheets. Any large supply changes in Treasury issuance may create yield volatility on the front end as the forces of supply and demand seek optimization. Investors may also decide to opportunistically invest in term securities, extending durations, as markets attempt to solve the timing and pace of future Fed Policy. We will continue to seek value in all asset classes and exploit market conditions that support domestic and global economic outlooks.
For more information about the portfolio holdings, please visit
https://www.firstamericanfunds.com/index/FundPerformance/PortfolioHoldings.html
Sources
Bloomberg
https://www.wsj.com/politics/house-senate-government-shutdown-vote-fccc16e6?mod=politics_lead_pos3
https://www.wsj.com/politics/policy/house-to-approve-six-spending-bills-leaving-six-still-to-go-60b1b8e2?mod=series_governmentshutdown
https://www.wsj.com/articles/whats-in-the-debt-ceiling-deal-461b9822?mod=us_lead_pos1
https://www.federalreserve.gov/monetarypolicy/files/monetary20240320a1.pdf
https://www.federalreserve.gov/monetarypolicy/files/fomcprojtabl20240320.pdf
https://www.federalreserve.gov/monetarypolicy/files/monetary20240131a1.pdf